TOC
Averaging histograms
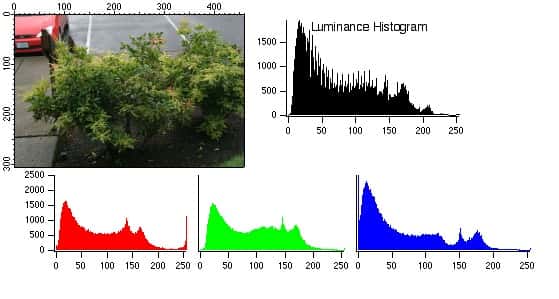
An image histogram is the number of each pixel value, which is displayed in the graph.
x axis of the graph is pixel value, range from 0 to 255;
y axis of the graph is the number of this pixel value;
1.How to averaging histograms?
Our goal is to generate a new image with a more even histogram distribution.
1.1 An equation
The accumulated value of the histogram is equal to the image resolution.
So we get an equation:
 q
 ∑  hist(k) = H*W
k=0
qis the max pixel value of original imagekis the pixel value from 0 to qhist(k)is the number of pixelk, not the coordinate value;His the height of original imageWis the width of original image
1.2 Another equation
The cumulative value of target histogram is equal to the one of original historam.
So we got:
 q              p
 ∑  hist(k) =  ∑ target_hist(k)
k=0            k=0
pis the maximum pixel value to be calculated;kis the pixel value from 0 to 255;target_histis same ashist, both mean the number of pixel.
1.3 Get average number of a target pixel
We want to average the histogram, so we make the number of each pixel value approximately equal to the average number of pixel in the image:
target_hist(k) = H*W/256
Here target_hist(k) means the average number of k, then we can get:
p
∑ target_hist(k) =  (p+1) * target_hist(k) = (p+1)(H*W/256)
k=0
then
q
 ∑  hist(k) = (p+1)(H*W/256)
k=0
we got
    q
p = ∑ (hist(k)/(H*W) * 256) - 1
    k=0
TAG: 直方图均值化,
REFERENCE:
「点个赞」
 Yaohong
点个赞
使用微信扫描二维码完成支付